From Battery Swaps to Sustainability: Electrum’s Journey in 2024
As 2024 comes to a close, it’s time to reflect on a transformative year for Electrum and the evolution of urban mobility. Hello, it’s me again, Andi Pangeran, and I’m a Principal Software Engineer at Electrum. This year, I’ve had the privilege of working alongside an incredible team to tackle the challenges of redefining transportation for a city of over 11 million people, one electric kilometer at a time.
We set ambitious goals in 2024: to create cleaner, smarter, and more sustainable transportation systems. As the year draws to an end, it’s clear we’ve made significant progress—not just in technology and operations, but in laying the groundwork for a future that benefits everyone.
In this post, I’ll walk you through what we’ve achieved in 2024, the lessons we’ve learned, and where we’re heading next. It’s also an opportunity to share how data and innovation have been central to our journey and will continue to guide us in the years to come.
2024 in Numbers: Impact That Matters
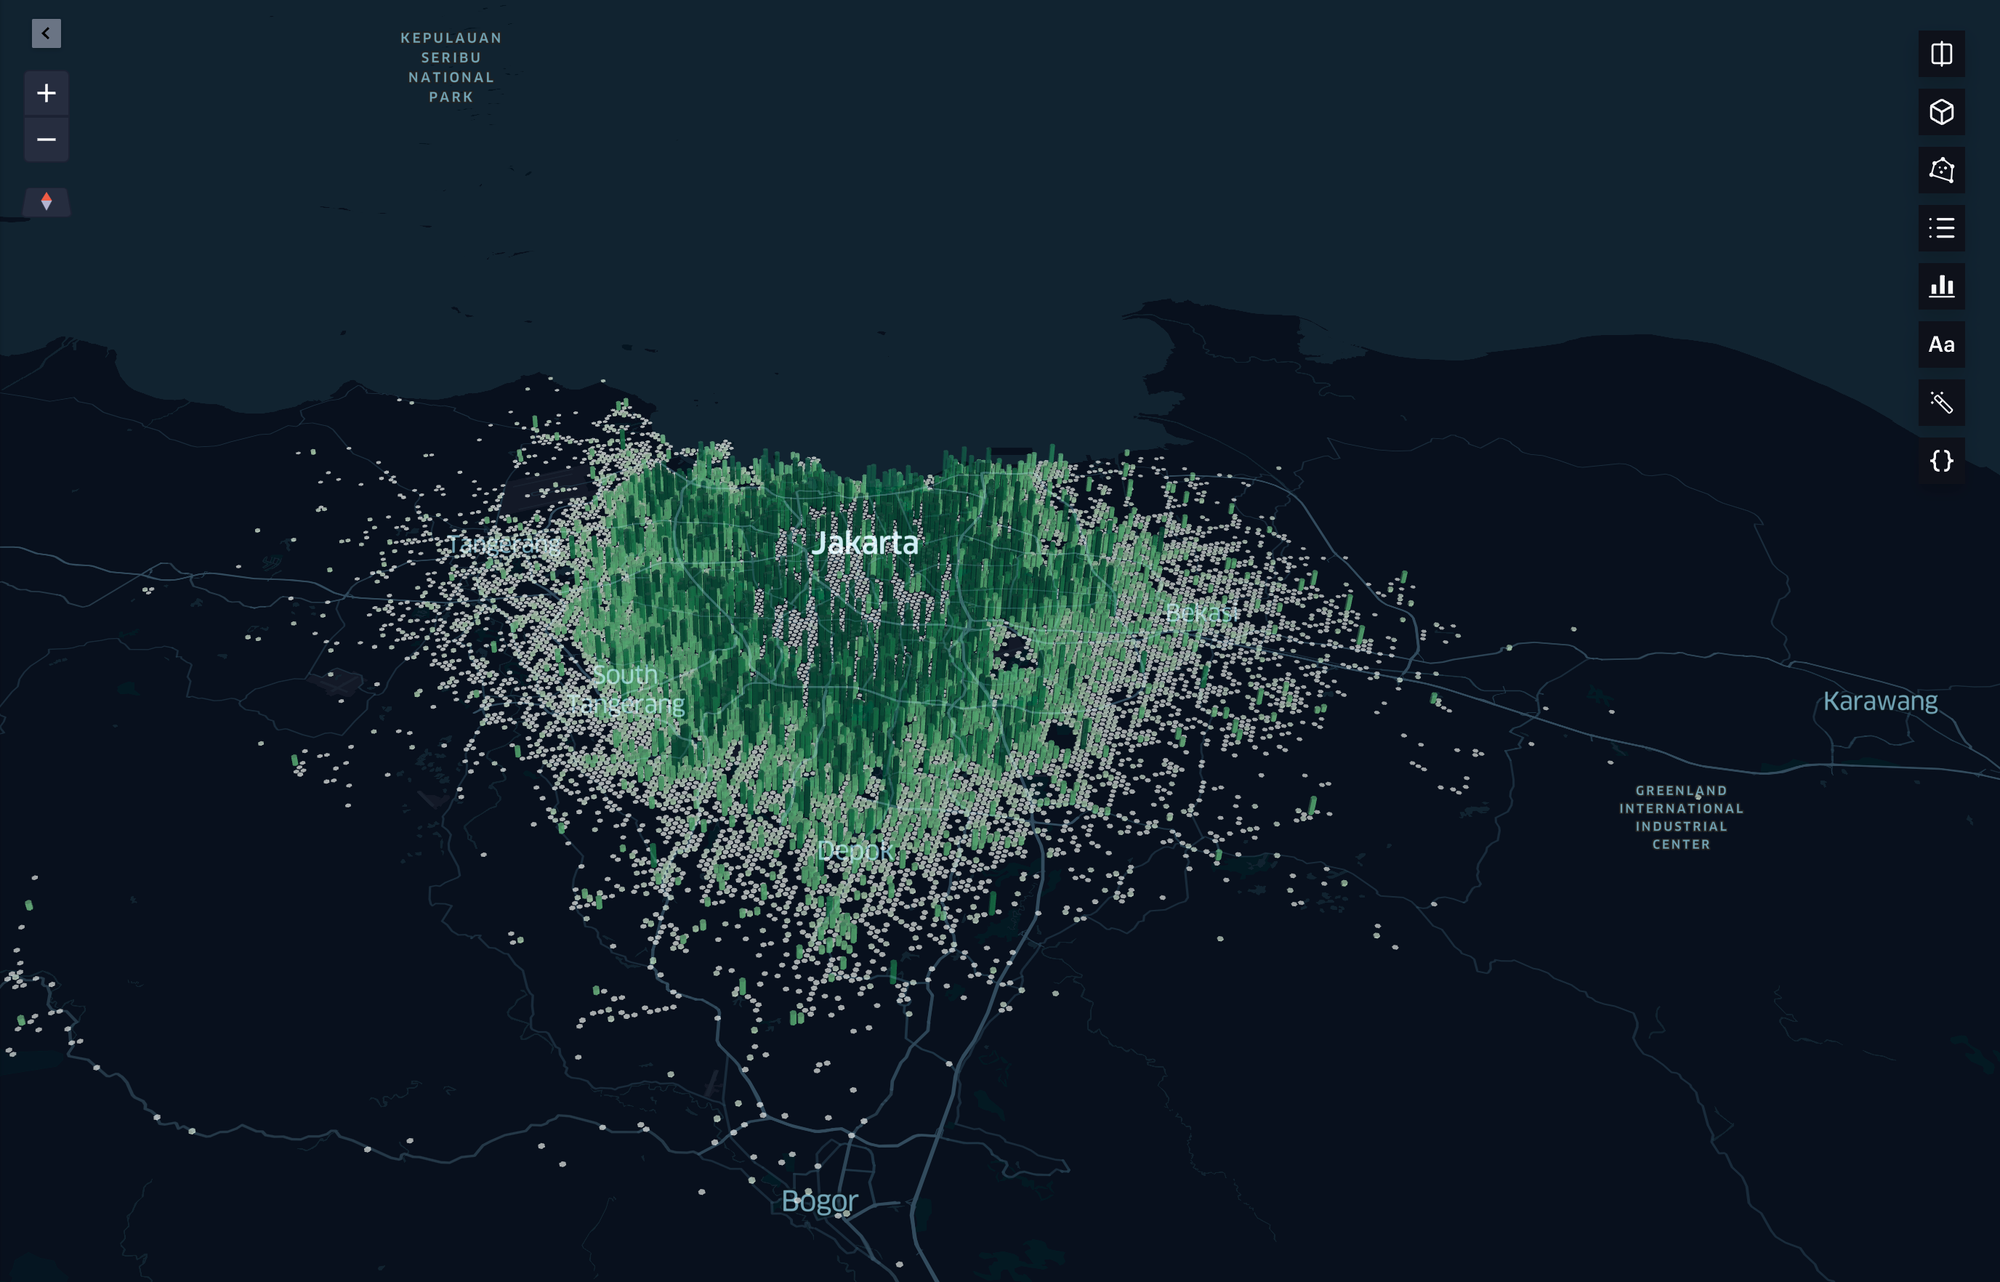
46 Million Kilometers Avoided Emissions H3 Heatmap
I believe numbers are more than just metrics—they are proof of progress, a reflection of effort, and a guide for what’s possible. Here’s how Electrum made an impact in 2024 :
Growing Our Network: Drivers and Stations
This year, our network of drivers and battery swap stations grew to make electric mobility more convenient for everyone:
- 3,500+ Drivers: A growing community of riders helping lead the transition to cleaner transportation.
- 250+ Battery Swap Stations: Located across Jakarta, making battery swaps fast and easy, so drivers spend less time waiting and more time moving.
Reaching New Heights: Trips and Distance
Electric motorcycles are becoming part of daily life in Jakarta. Here’s how far we’ve come:
- 8.8 Million Trips Completed: From work commutes to leisure rides, electric mobility is reaching all parts of the city.
- 46 Million Kilometers Traveled: That’s like going around the Earth 1,150 times!
Impact on the Planet
This year, we avoided 998.20 metric tons CO₂e—the same as the carbon absorbed by over 60,600 trees in a year. This means cleaner air, quieter streets, and a healthier Jakarta.
Supplementary Reference: Emissions Calculations: For those interested in the details, we’ve included the full emissions calculation breakdown as a supplementary reference.
Additional Notes: Tree Equivalency and Environmental Benefits: While our tree equivalency estimates provide a general idea of the emissions avoided, the actual number may vary depending on the species of trees used. Beyond CO₂ sequestration, tree planting also helps improve air quality, supports biodiversity, and prevents soil erosion, making it a valuable part of a broader environmental strategy.
Jakarta’s Mobility: Using Data to Make a Difference
In 2024, we used H3 heatmap technology to better understand how people move with Electrum. This technology divides Jakarta into small hexagons, showing detailed mobility patterns. By analyzing this data, we improved our service, expanded to new areas, and planned for the future.
Here’s how the data guided us this year, with visual insights to show the impact:
1. Citywide Reach
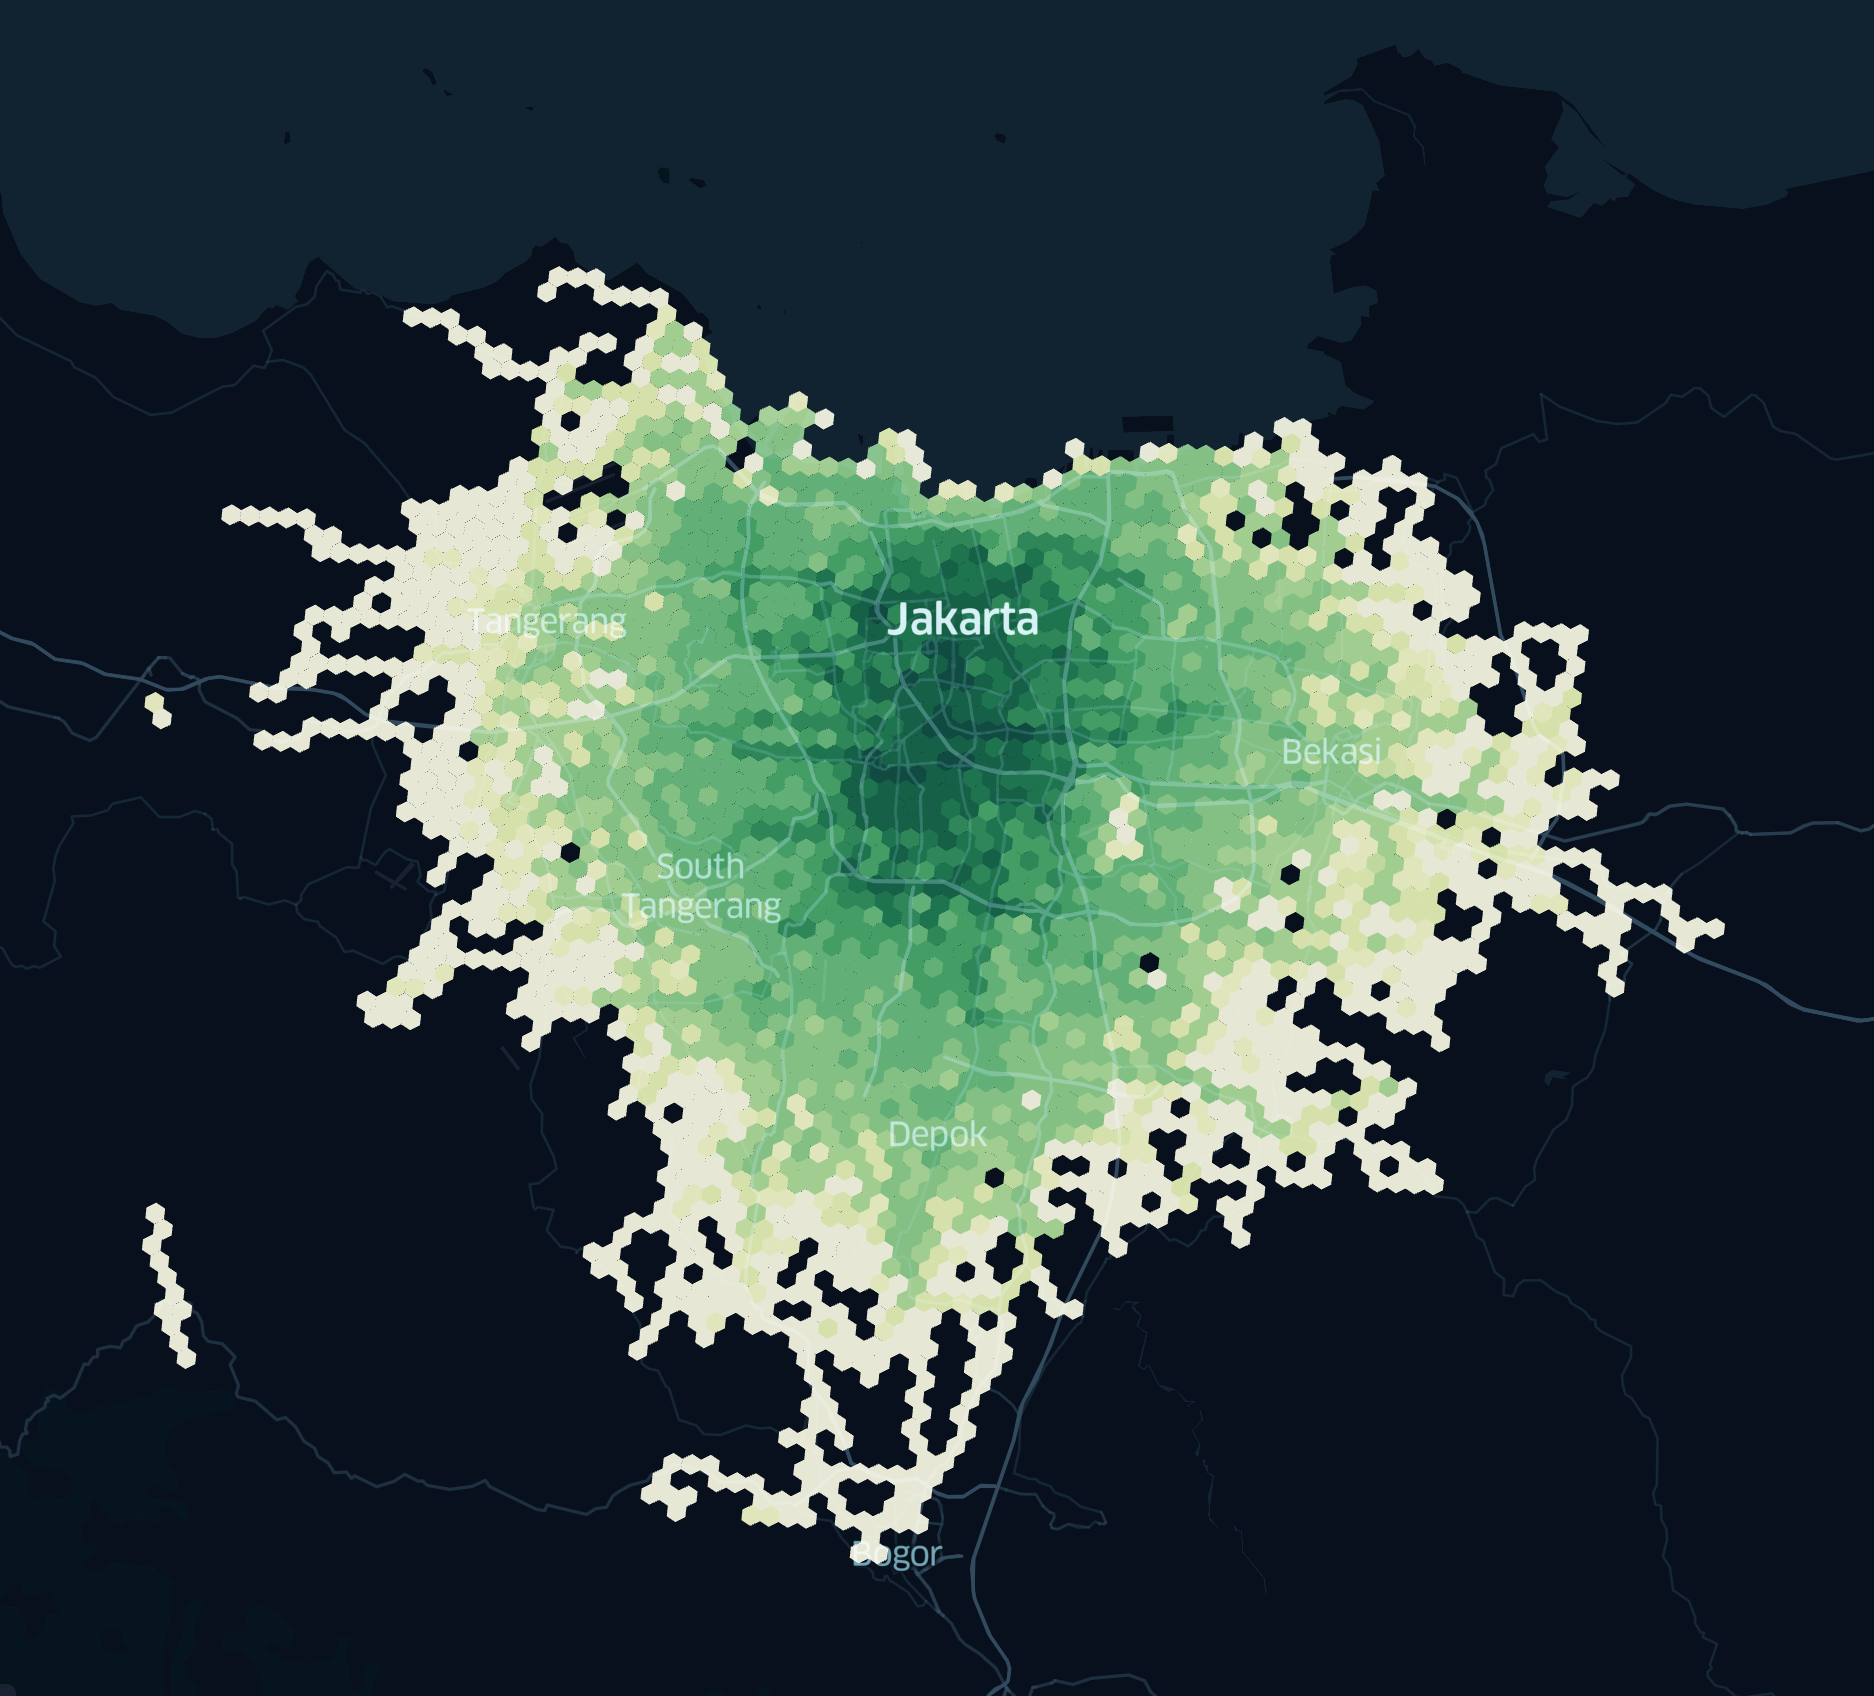
This map shows how Electrum drivers have been riding across Jakarta and nearby cities like Bekasi, South Tangerang, and Depok.
- Dark Green Areas: Places with the most trips, showing where our drivers are busiest.
- Lighter Areas: Zones where our drivers are starting to ride more, showing areas with potential for growth.
We were amazed when we saw the data on the bottom left—someone was using our electric motorcycle in an area without a battery swap station. Upon investigation, we discovered that an alpha customer had purchased charging tools and was charging their bike at home.
2. Hotspots in Jakarta
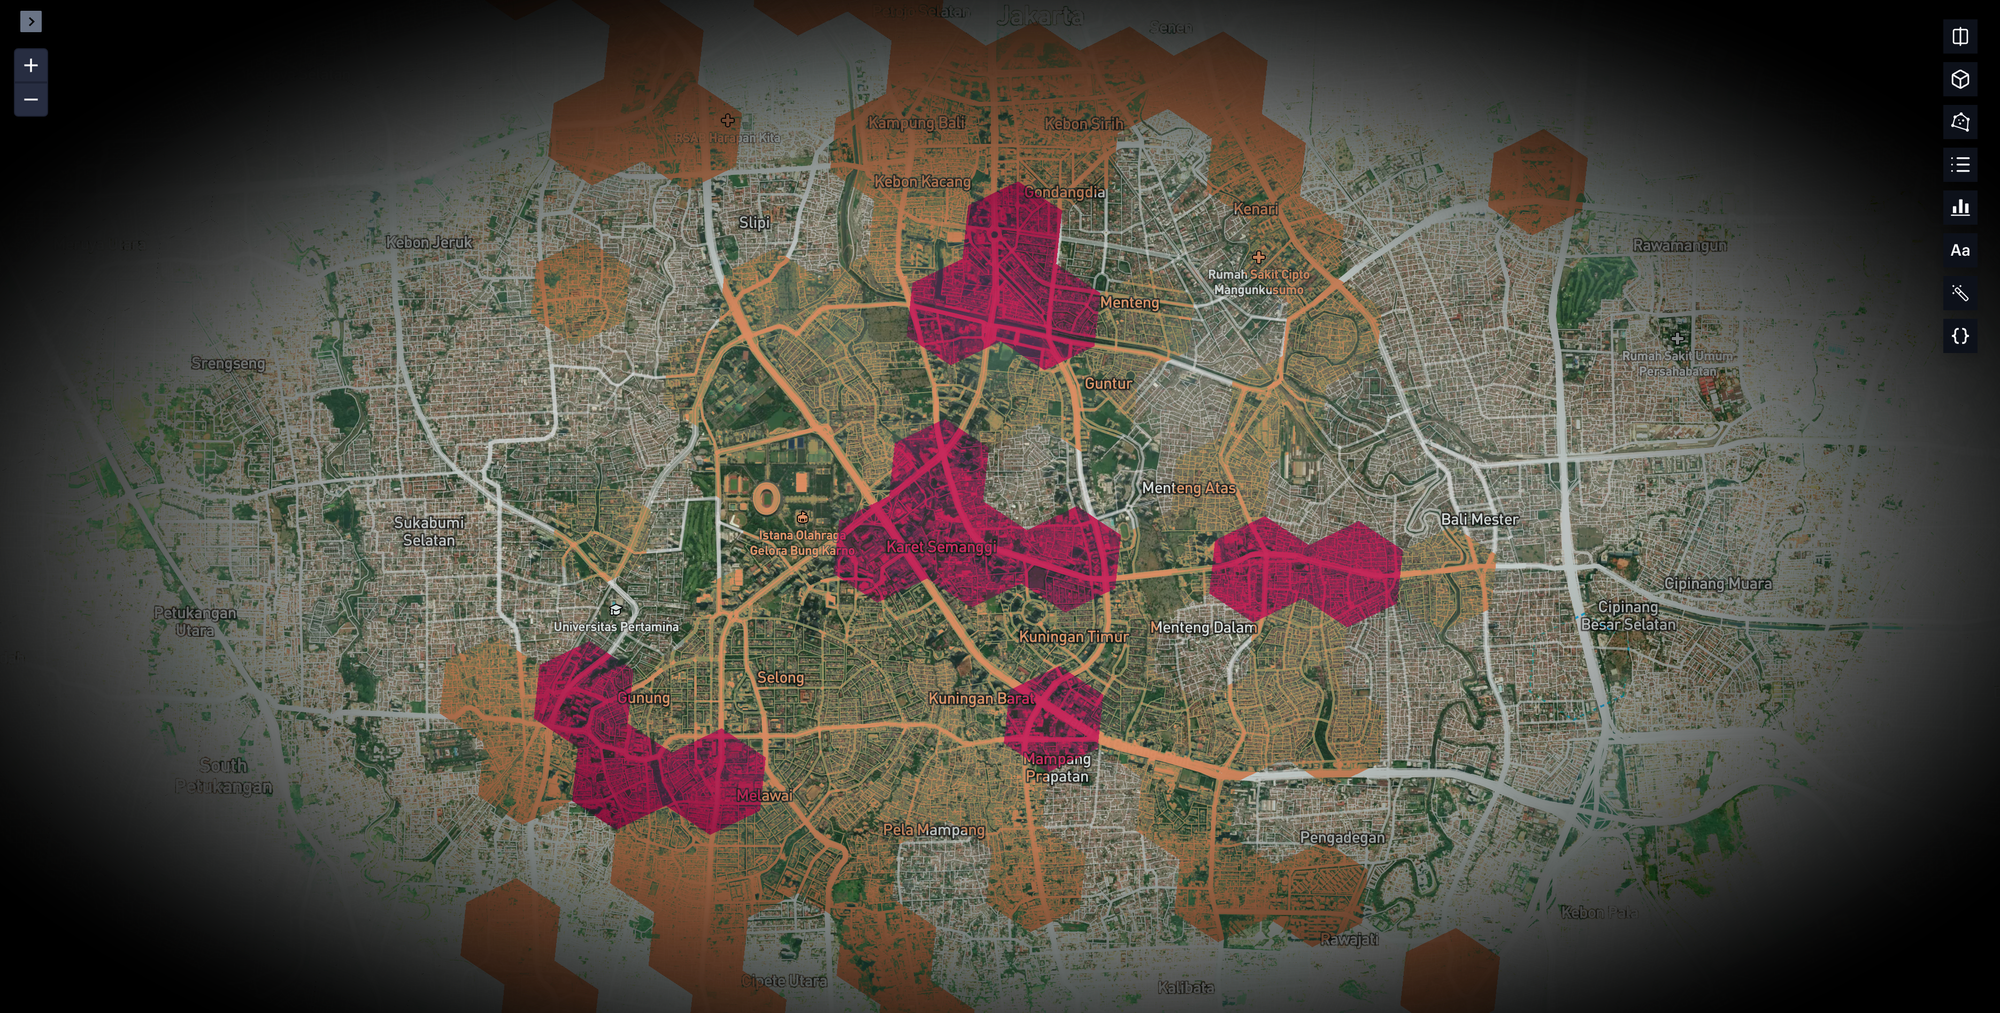
The heatmap shows key areas in Jakarta where Electrum drivers ride the most. These hotspots highlight where trips happen for both work and leisure:
- Bundaran Semanggi & Setiabudi: Busy areas with many offices and commuters.
- Bundaran HI: A central place for work, shopping, and leisure activities.
- Karet & Melawai Corridors: Popular areas for dining, shopping, and casual trips.
3. Operational Planning
The heatmap is not just about seeing where trips happen—it’s a tool to improve operations. Here’s how we used it:
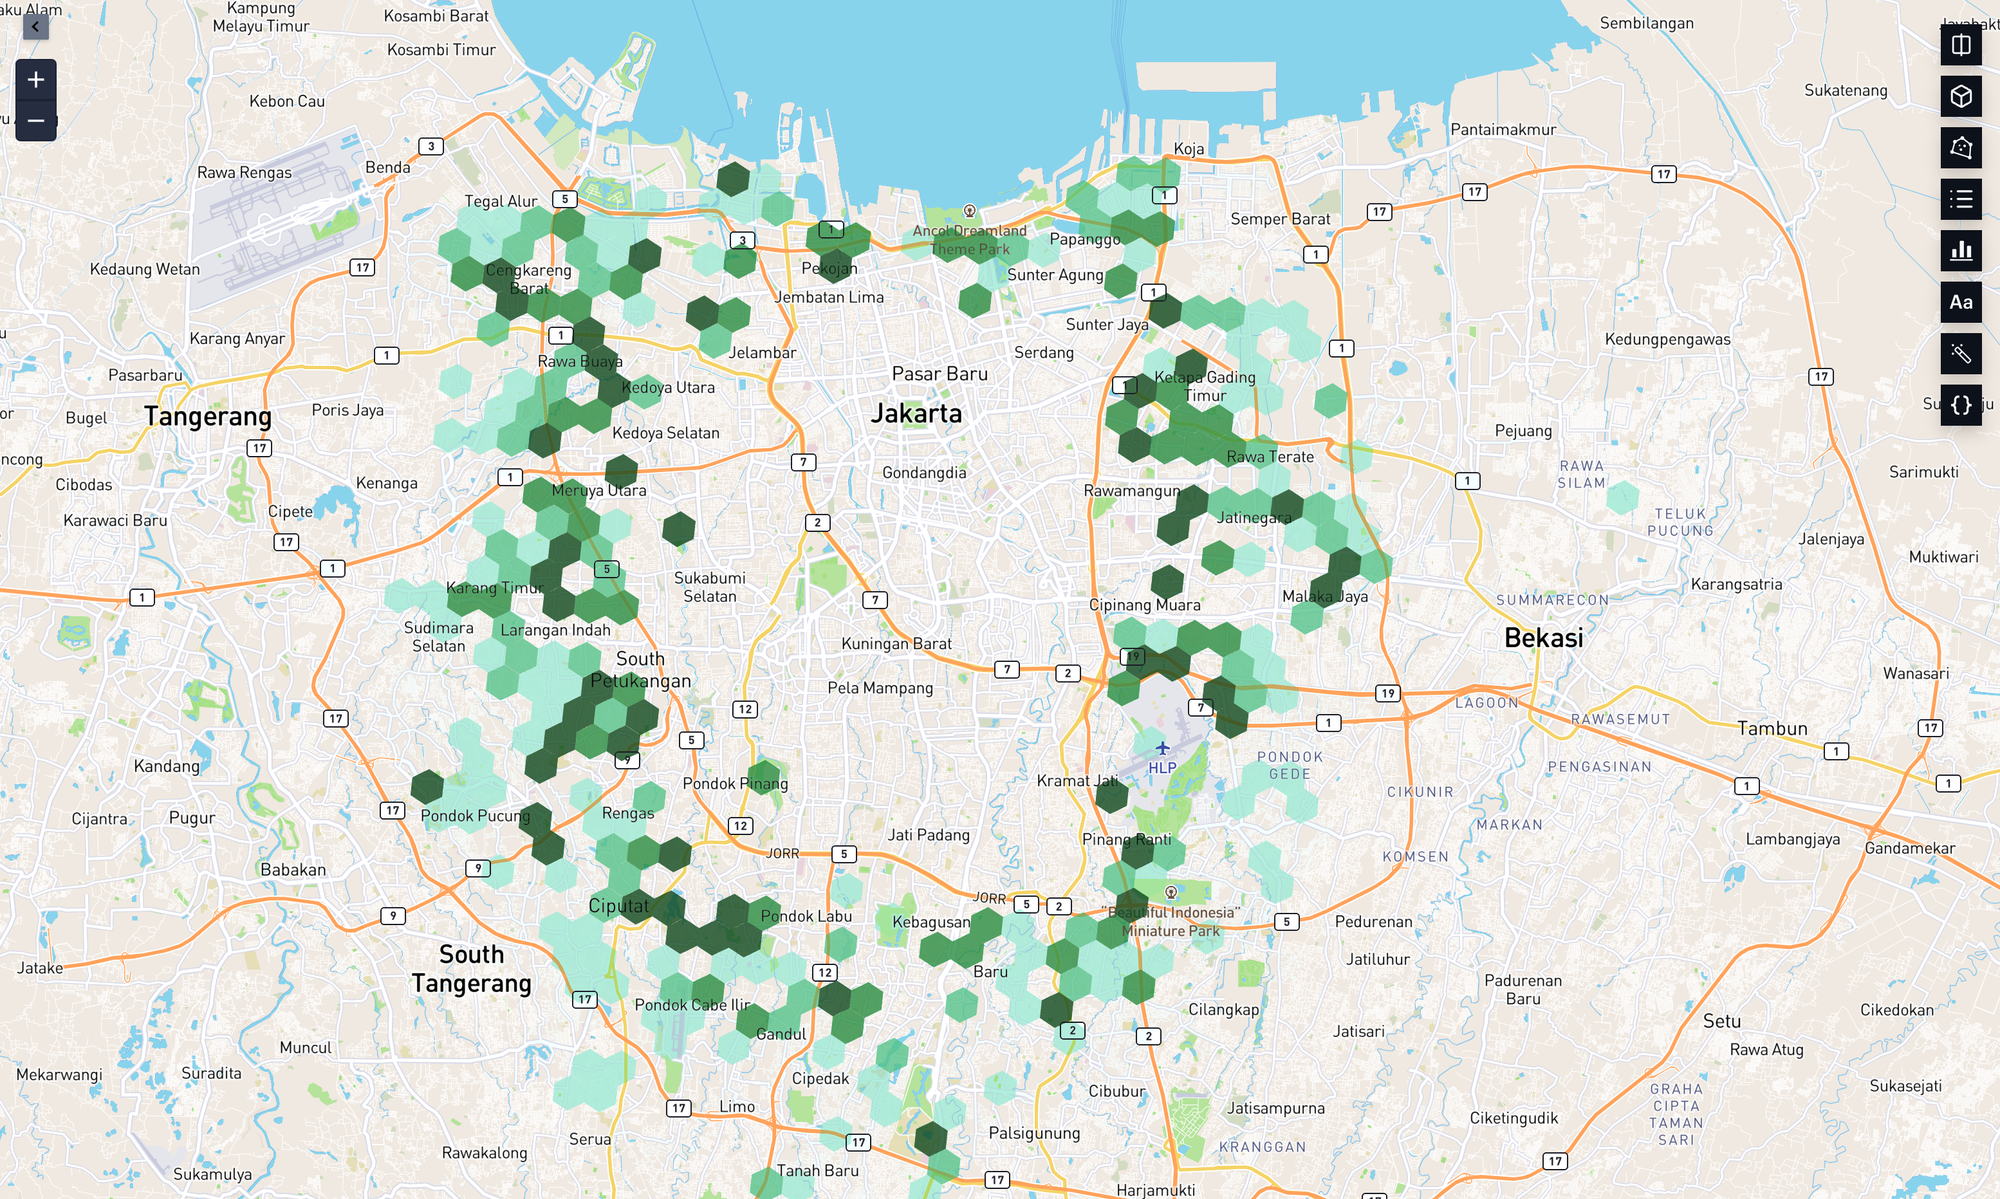
- Planning Battery Swap Locations: We identified high-demand areas and placed new stations where drivers need them most.
- Optimizing Resources: During peak times like 7:00–9:00 AM, the heatmap helped us focus vehicles in busy zones to meet demand.
- Identifying Growth Areas: The data showed quieter zones where we can expand our fleet and services in the future.
The heatmap is more than a visualization—it’s a decision-making tool that helps us grow smarter and serve our users better. Each glowing hexagon on the map represents progress, and together, they show how Electrum is driving cleaner and more efficient mobility solutions.
Step by Step: Highlights of 2024
Progress isn’t just about the final results—it’s about the steps that brought us here. This year, we worked on many things, from building new systems to listening to feedback from our partners. Here’s how 2024 unfolded:
January–March: Laying the Foundation
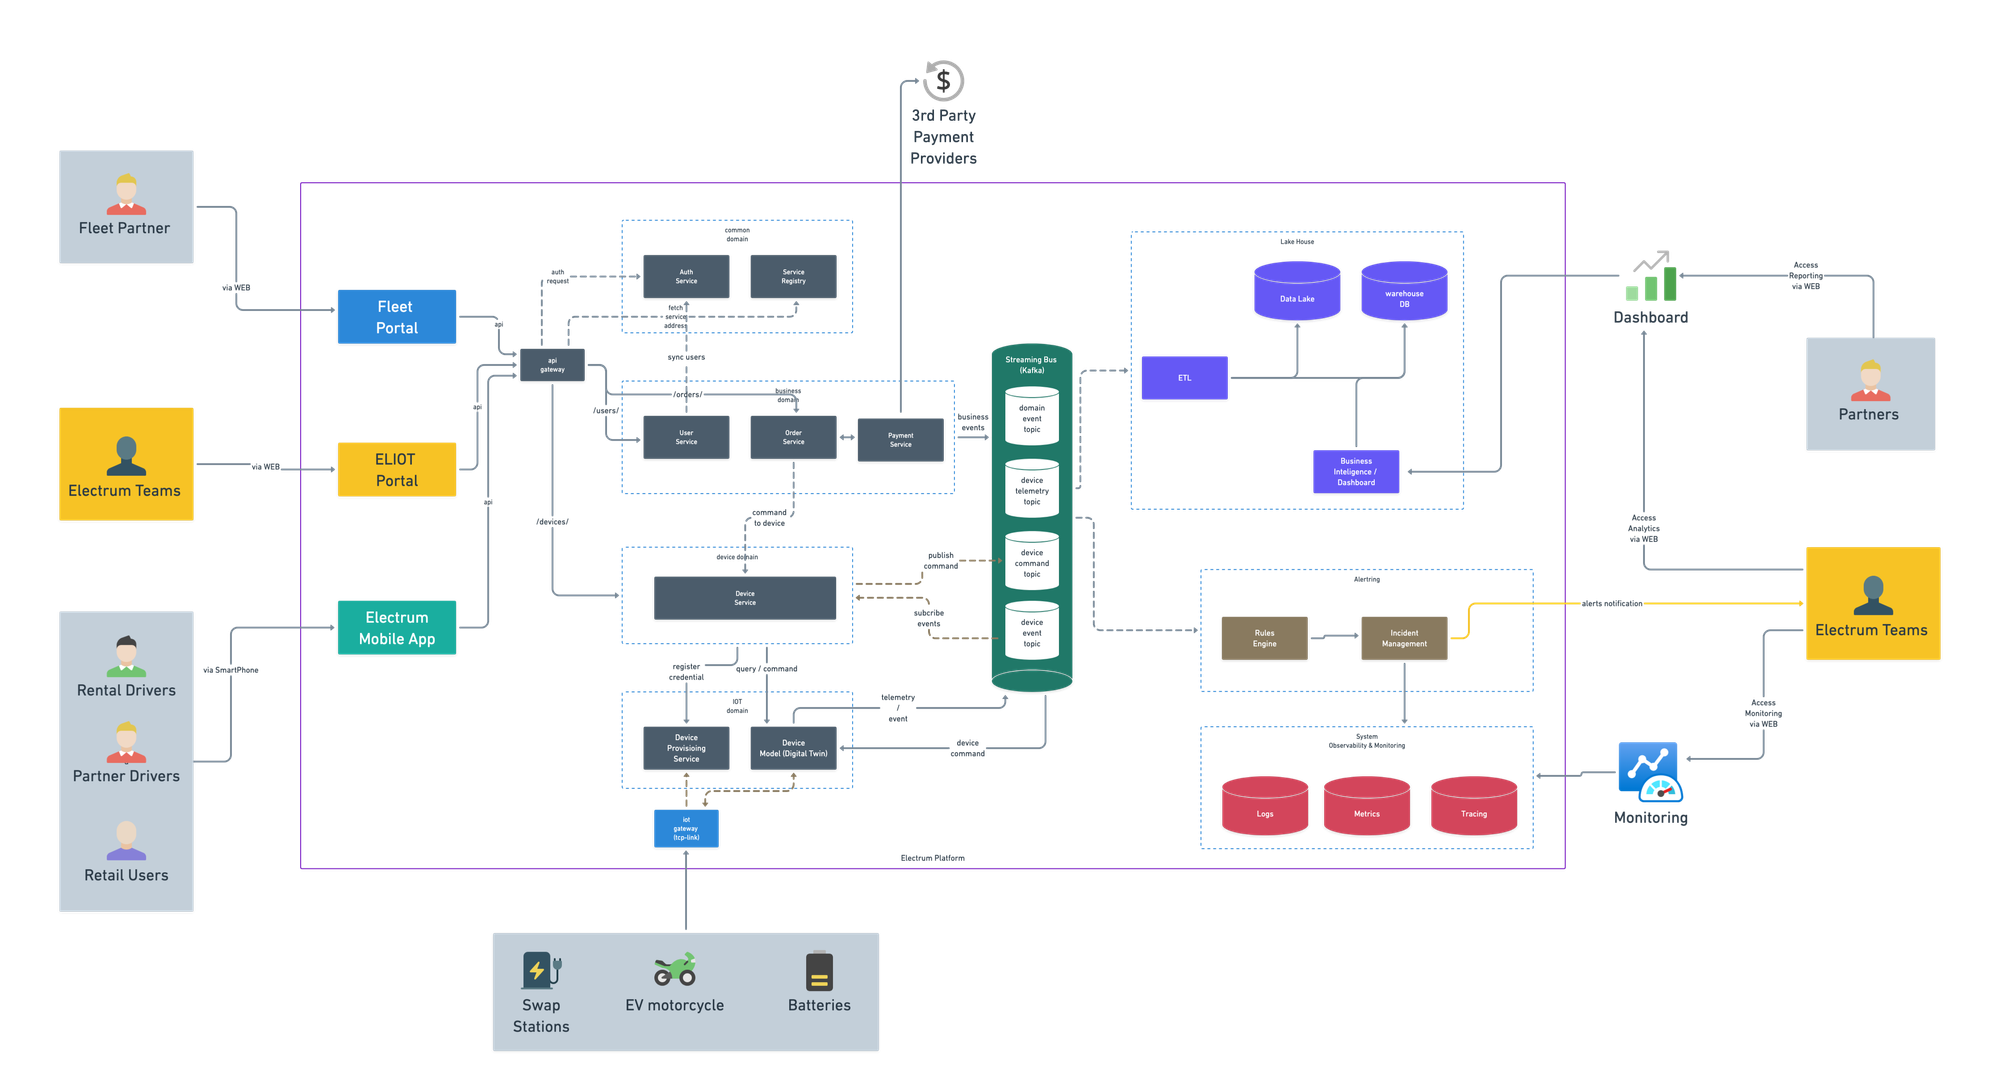
At the start of the year, we focused on building our core systems. In March, we launched ELIOT (Electrum Ledger & IoT Platform System). This system, built entirely from scratch, helped us improve how we manage devices and battery swapping. ELIOT also introduced features like remote commands and over-the-air (OTA) updates, which made it easier to scale our devices and add new capabilities.
April: Expanding Accessibility
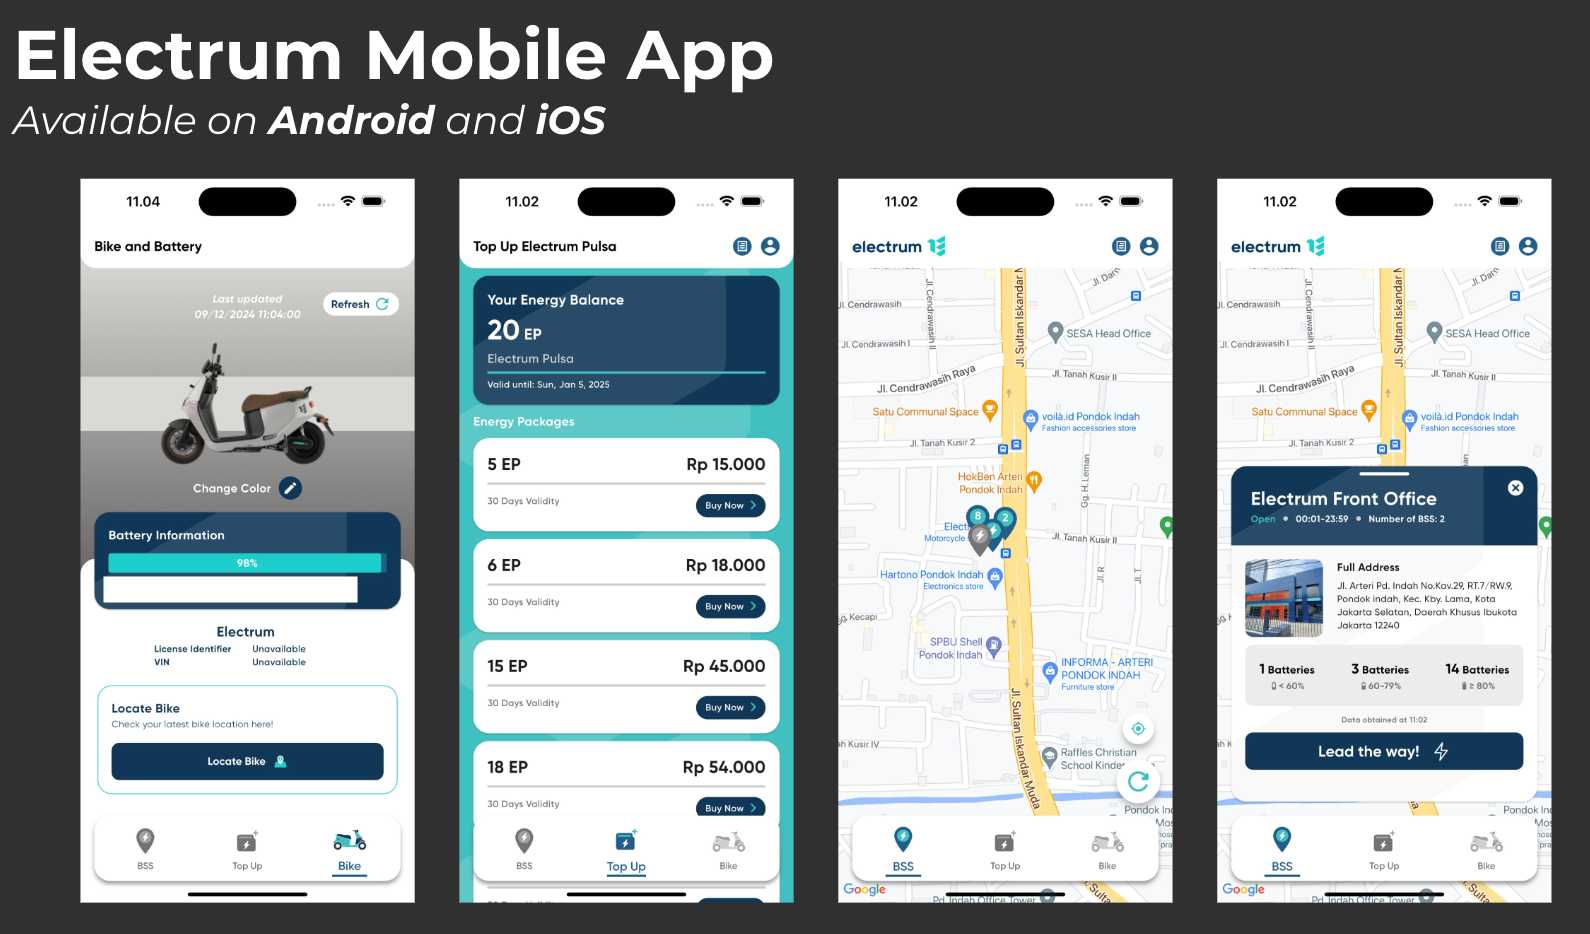
In April, we launched a new mobile app for both Android and iOS. This app gave users a better way to manage their battery swaps, track their usage, and access new features more easily.
May: Data-Driven Beginnings
In May, we completed our Data-Platform. This system allowed us to track and analyze our operations more effectively. In the first month of using it, our fleet traveled 2.1 million kilometers. This showed how data can help us improve our services.
June–July: Scaling Up
During these months, more people started using our services. The kilometers traveled increased from 3.3 million in June to 4.2 million in July. This growth showed us that more people trust electric vehicles as a reliable transportation option.
August–September: Expanding Reach
In August, our fleet traveled 6.9 million kilometers, growing to 7.5 million kilometers in September. We also worked closely with new partners, running pilot projects and listening to their feedback. This helped us better understand what they needed and allowed us to expand our services to more segments.
October–November: Fleet Management Platform
In October and November, we broke records, traveling over 9 million kilometers each month. We also launched our Fleet Management Platform. This platform allows our partners to manage their own fleets, drivers, and operations. With it, partners can even run their own Electrum-powered businesses. This was a big step toward making our technology more flexible and useful for others.
December: Wrapping Up the Year
As of now, December is already showing strong growth compared to the same date in November. While the month isn’t over yet, we are seeing consistent usage and kilometers traveled, reflecting the steady trust and demand for Electrum’s services. The year-end results are shaping up to cap a year of significant progress.
Looking back, these steps show how we are building not only better systems but also a cleaner, more efficient transportation solution. It’s not just about the technology—it’s about the people we serve and the partners who work with us to make this possible.
2024 Through Our Blog Posts
Throughout the year, we shared our progress and innovations through blog posts. Here’s a summary of what we published in 2024:
- "Hello, World! Electrum’s Journey Begins Here"
Published on July 10, 2024
This post introduced Electrum’s mission to transform transportation in Indonesia with clean and efficient electric vehicles. It explained our vision for a greener city and how we planned to achieve it.Read more - "ClickHouse in Action: Driving Electrum’s EV Data Platform"
Published on October 19, 2024
This article explained how we use ClickHouse, a fast database system, to process and analyze large amounts of data. It showed how this helps us make real-time decisions to optimize our fleet operations.Read more - "Building Electrum's IoT Ecosystem: A Journey to Scalable and Secure Battery Swapping"
Published on November 1, 2024
This post shared how we developed a secure and scalable IoT system for our battery swap stations. It highlighted how this system supports smooth operations and prepares us for future growth.Read more - "Optimizing IoT Battery Swap Stations with Seamless Over-the-Air Updates"
Published on November 15, 2024
We described how over-the-air (OTA) updates keep our IoT-enabled battery swap stations running efficiently without manual intervention. This post highlighted the importance of automated updates for maintaining reliable service.Read more - "[Electrum Podcast] Exploring Battery Swapping Solutions in Indonesia"
Published on November 22, 2024
In this podcast, we discussed the future of battery swapping in Indonesia with industry experts. It covered the challenges, opportunities, and impact of this technology on urban mobility.Listen here
These posts show how Electrum is not just growing but also innovating, sharing ideas, and contributing to the broader discussion on clean and sustainable mobility.
Looking Ahead: What’s Next in 2025
As we step into 2025, we are focusing on improving reliability, scaling our operations, and strengthening collaborations to make electric mobility even better. Here’s what’s next:
Strategic Goals for 2025
- Expanding Our Fleet
We plan to grow the number of electric vehicles in our fleet to serve more areas and meet the increasing demand for clean and efficient transportation. - Improving Technology
One of our key focuses is developing an offline swap experience, ensuring battery swap stations can operate smoothly even during internet interruptions. This will improve system reliability and user experience. - Building More Swap Stations
Adding new battery swap stations in strategic locations will reduce wait times, improve convenience, and expand access to electric mobility for more users. - Empowering Partners
We aim to expand our network by bringing in new partners while enhancing tools like the Fleet Management Platform. These tools will help partners manage fleets, drivers, and operations more effectively, supporting their growth and enabling them to scale.
What’s Next for the Blog
In 2025, we’ll continue sharing insights into the technology and operations behind Electrum. Here’s what to expect:
- Real-Time Spatial Data Engine:A behind-the-scenes look at how we use H3 heatmaps to analyze and optimize mobility patterns.
- Building a Scalable Transaction EngineExplore how we developed a robust transaction engine and a ledger system to manage balance usage for battery swaps, ensuring reliability and scalability as operations grow.
- Battery Insights:Discover the unique aspects of our batteries, from their design to their performance, and how they contribute to cleaner urban transportation.
- Scalable Infrastructure:Learn how we use Kubernetes (K8s) and tools like Karpenter to maintain a reliable and efficient system as our operations grow.
These posts will provide a deeper understanding of the innovations powering Electrum and our mission to drive cleaner, more connected transportation in Jakarta and beyond.
Final Thoughts: Moving Forward Together
As we reflect on 2024, it’s clear that our journey is about more than just technology or numbers—it’s about the people and partnerships that drive progress. Every kilometer traveled, every system launched, and every collaboration formed has brought us closer to a cleaner and more sustainable future.
While we’ve achieved significant milestones this year, there’s still much work ahead. Our focus remains on improving our systems, expanding our reach, and building stronger collaborations to make electric mobility more reliable and accessible. By combining innovative technology with meaningful partnerships, we can continue to drive impact where it’s needed most.
To everyone who has been part of this journey—our team, partners, and users—thank you. Together, we are shaping the future of transportation, creating solutions that serve not only today’s needs but also tomorrow’s possibilities. Let’s move forward, together.
References
For more insights into the geospatial technologies and methodologies used in Electrum’s journey, explore the following resources:
- H3 Geo: Learn about H3, the geospatial indexing system that powers advanced data visualization and analysis.
- Uber Blog on H3: Understand how H3 is applied in real-world scenarios, including trip density mapping and route optimization.
- Foursquare’s Guide to Using H3 for Geospatial Analytics: Discover practical applications of H3 for analyzing urban mobility and building smarter cities.
Supplementary Reference: Emissions Calculations
For transparency, we’ve included detailed emissions calculations here. These figures outline: